 Skip to main contentSkip to footer
There is no doubt that infographics are all the rage right now. They are popping up all over the web, and for good reason – they are an incredibly effective way to communicate complex information quickly and easily.
However, before you start creating infographics for your own website, it is important to understand the pros and cons of using them.
The pros and cons of infographics include communicating complex information quickly and easily. But they can also be time-consuming, limited on information and expensive to create, among other things. Consider using an infographic template or hiring a professional for the best results.
When we first started creating infographics for our clients, we didn’t really know what we were doing. We just threw together some charts and graphs and hoped for the best. But over time, we’ve learned a lot about what makes a great infographic. And, more importantly, we’ve learned what doesn’t work.
In this article, we will take a look at the pros and cons of infographic design, so that you can decide whether or not they are right for investing your time and resources in to.
Table of Contents
What’s An Infographic, And Why Are They Useful?
An infographic is a visual representation of data or information. They are used to communicate complex information quickly and easily. Infographics can include charts, graphs, illustrations, and other images.
I didn’t realize how useful infographics were until I started working with a lot of data. I would sit there for hours, trying to make sense of all the numbers. But when I saw that same data represented in a visually appealing way, it was so much easier to understand.
To illustrate this point, allow us to get meta for a moment and create an infographic about infographics.
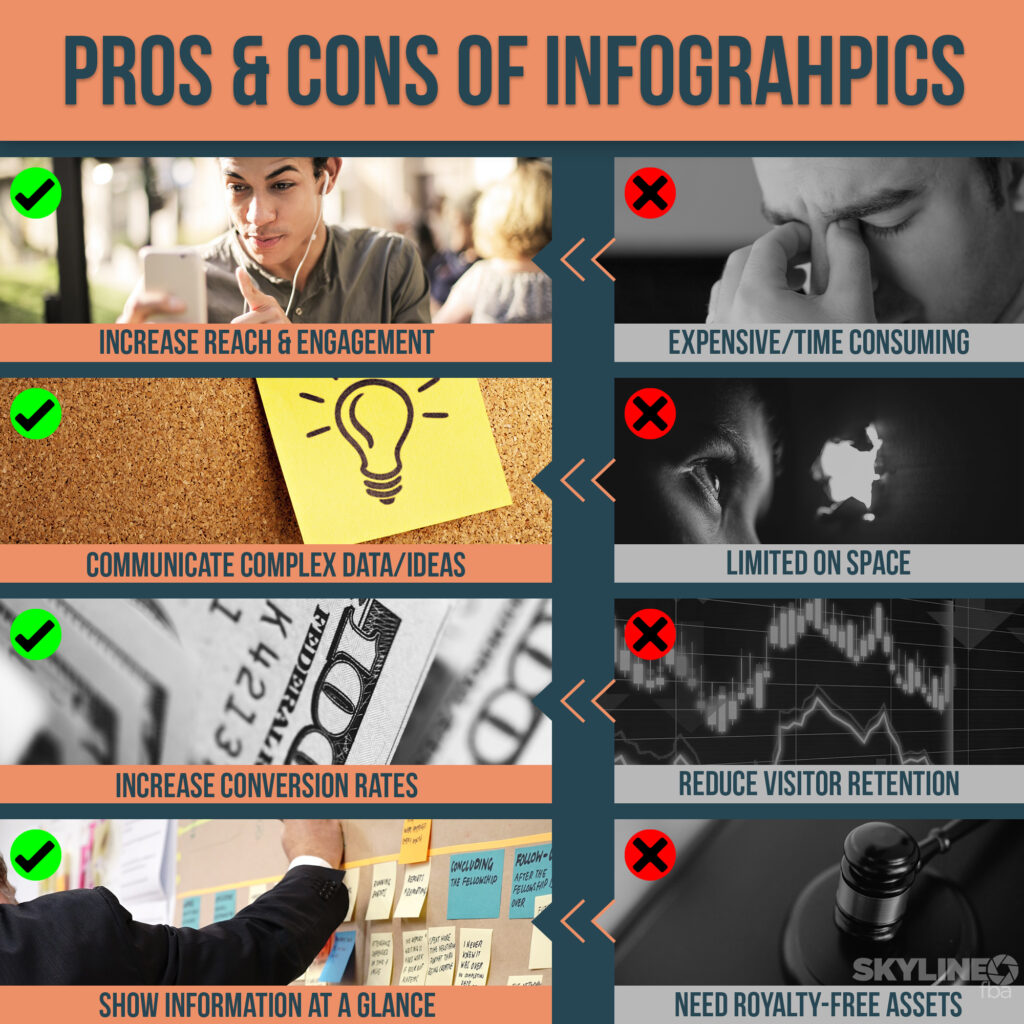
Advantages of Infographics (Pros)

There are a number of pros to using infographics. First, they are visually appealing and can help to break up text-heavy content. They are also easy to share, which can help to increase your reach and engagement. Additionally, infographics can be used to rank in Google search results.
But there are far more advantages to that when it comes to e-commerce and user retention, social media, and lead generation.
Infographics Make Complex Information Easy To Understand
One of the biggest advantages of using infographics is that they can make complex information easy to understand. This is because they allow you to present data in a visually appealing way.
Instead of just looking at a bunch of numbers, you can see how those numbers relate to each other. And, when done correctly, infographics can tell a story that is easy for the average person to follow.
This is why infographics are so popular with businesses and organizations. They can take a lot of complicated data and turn it into something that is easy for their target audience to understand.
Infographics Help Increase Your Reach And Engagement
Whether it is an idea that people can relate to or the stunning visuals, infographics are easy to share.
This means that they have the potential to reach a much wider audience than other types of content. And, because they are so easy to share, people are more likely to engage with them.
For example, our infographic about the pros and cons of infographics might be shared by someone who is interested in design and wants to sell more of their services. But, it could also be shared by someone who is looking for information about whether or not they should use infographics in the first place.
This increased reach and engagement can lead to more website traffic, social media followers, and email subscribers.
Additionally, if people enjoy your infographic, they are likely to share it with their own audience. This can help to increase your brand awareness and reach even further.
Infographics Can Help You Rank In Search Engines
If you want people to find your content, you need to rank in Google search results. And one of the best ways to do this is by optimizing your content for specific keywords.
Google is getting smarter every day and actually have an AI system called Cloud Vision with the ability to read the text within an image, which means that they are now able to interpret and index infographics.
When you use infographics, you have the opportunity to include your target keywords in the title, description, and tags of the image as well. This can help you to rank higher in Google search results, which can lead to more website traffic.
Information Within Infographics Is Retained More
Did you know that visual information is actually retained more than text information?
It’s true!
According to some studies, people can remember up to 65% of the visual information they see three days later. But, when it comes to textual information, they can only remember about 20%.
This is why visual content such as product photography and video is so important for businesses wanting to sell their products and services online, particularly because the effectiveness is only going to continue to increase.
As we become more and more inundated with content, we are less likely to remember text-based information. But, if that information is presented in a visual way, we are much more likely to recall it later on.
So, if you want your audience to remember your content, using infographics is a great way to do it.
Infographics Convey Information At A Glance
In today’s busy world, people don’t have time to read through a long blog post or article. But, they might be willing to take a quick glance at an infographic if it looks interesting.
Infographics can convey a lot of important information in a very short amount of time, such as statistics, data, and key points.
Infographics Help Customers Make Purchasing Decisions
If you are selling products or services, infographics can be a great way to help your customers make purchasing decisions and choose your product over your competitors.
This is because they can provide potential customers with all of the information they need to know about your product or service in an easy-to-understand format.
For example, if you are selling a new skincare product, you could create an infographic that compares your product to other similar products on the market.
Your infographic could include information about the ingredients, how it works, what results people can expect, and anything else that might be important for someone making a purchasing decision.
By providing potential customers with this information at a glance, you can increase your conversion rates significantly.
Good Infographics Increase Traffic & Links
As we mentioned before, if people enjoy your infographic, they are likely to share it with their own audience.
This can help to increase your brand awareness and reach even further.
And, when people share your infographic on their website or blog, they will often link back to your site as well. This is great for two reasons.
First, it will help to increase your website’s traffic. Second, it will give you a valuable backlink from an external website, which can help to improve your rankings in the search engines.
Disadvantages of Infographics (Cons)

While infographics have a lot of pros, there are also some cons to consider. First, they can be expensive to create if you hire a professional designer. They can also be time consuming to design, especially if you don’t have experience with graphic design. Additionally, infographics may not be effective for all types of content.
Finally, if you use too many infographics on your website, it can start to look cluttered and unprofessional.
Infographics Can Be Expensive To Create
Although you can technically get an infographic created by a freelancer for $5 on Fiverr, if you want a high-quality infographic that is going to help you achieve your business goals, you’re likely going to have to spend a bit more.
Because infographics need to be concise, all of the information and data you want to convey needs to be carefully considered.
Experts in graphic design are able to take complex data and turn it into an easy-to-understand visual. This takes a lot of time, effort, and skill.
If you want to create infographics that are going to help you reach your target audience and achieve your business goals, it’s worth investing in a professional designer.
Infographics Can Be Time Consuming To Design
“I would have written a shorter letter, but I did not have the time.”
Blaise Pascal
Although the information contained within an infographic is concise, effective infographics need considerable time to research, write and design to ensure that every word and element work together to communicate and achieve the desired result.
This is because the more brief the information you want to include, the more time it’s going to take for the designer to consider how every piece of information works together to create a visually appealing way to convey that information.
Infographics Can Be Misinterpreted
If infographics aren’t designed properly, they can actually be confusing and difficult to understand, which runs the risk of being misinterpreted.
For example, a line graph that is not clearly labeled could be interpreted in a number of different ways, such as showing a decrease when it is actually showing an increase.
To avoid this, it is important to make sure that your infographic is designed by a professional who understands how to effectively communicate with visuals.
Information Is Limited On Space
When you use an infographic, you are limited to the amount of information that you can include.
This is because they need to be concise and to-the-point in order to be effective.
As a result, you may need to leave out some important information in order to make your infographic readable and understandable.
Before deciding to use an infographic, you need to determine if the information you want to include can be effectively communicated in this format.
Infographics Need A Graphics Library
To be effective, an infographic must be well-designed and use high-quality visuals. This means that you will need access to a graphics library with a wide variety of images, icons, charts and other visual elements.
If you don’t have access to a good graphics library, your infographic is likely to end up looking cheap and unprofessional.
To make matters worse, if you think you can simply swipe something from off the internet then you could be in for a nasty shock. Many of the images used in infographics are copyrighted and you could find yourself on the receiving end of a lawsuit if you use them without permission.
In order to avoid any legal issues, it is important to only use royalty free or creative commons images in your infographics, which we specifically allow in our Product Infographic Template pack.
Infographics Can Cause A Drain On Your Webserver
Because of how shareable infographics are, they have the potential to quickly go viral and cause a drain on your webserver resources – particularly if other websites are hotlinking to the image file on your server.
When other websites hotlink to your infographic images, it can cause a significant drain on your server resources, resulting in slower loading times for your website, broken elements, lost sales and frustrated customers.
To avoid this, it is important to host your infographics on a separate server or use a content delivery network (CDN), such as Cloudflare.
Infographics Can Lower Visitor Retention
They say the average attention span of someone online these days is about eight seconds.
An infographic is likely to take up more space on a page than regular text, which means it could actually lower your website’s visitor retention rate.
This is because people are less likely to scroll down and continue reading if they see a large infographic that takes up most of the screen or has too many words in it.
Additionally, well designed infographics that do well with conveying information at a glance also have the potential to lower retention rates of your online visitors because they are able to find what they are looking for quickly and move on, without ever reading the rest of the content.
This is why recipe sites are notorious for annoying visitors with lengthy stories of the dish’s origin before getting to the actual recipe.
FAQ’s About Infographics

Now that you know a little more about the pros and cons of infographics, you may be wondering if they are right for your business.
To help you make that decision, we have put together a list of frequently asked questions about infographics.
Do I need to be a designer to create an infographic?
While you don’t need to be a designer to create an infographic, it does help if you have an eye for design and know how to use graphic design software.
If you don’t have any experience with graphic design, then we recommend using a template or hiring a professional designer to create one for you.
How long should an infographic be?
The length and size of an infographic depends on the subject matter and the amount of information you want to include. However, infographics should be easily seen on mobile devices.
Generally speaking, an infographic should be no longer than 2000 pixels in width and no more than 3000 pixels in length.
Are infographics effective 2022?
Infographics are not only still effective in 2022, they are more popular than ever before.
A recent study found that 90% of information shared online is in the form of images.
This is because images are a much more effective way of communicating information than text. Not only do they allow you to quickly and easily get your point across, but they are also more likely to be shared.
This means that if you want your information to be seen and shared, an infographic is the way to go.
What makes an infographic bad?
An infographic can be bad for a number of reasons.
It can be too long, have too much text, or be difficult to understand. Additionally, an infographic can be bad if it is not properly optimized for the web or if it does not accurately represent the data.
Bad infographics are also difficult to see on mobile devices and typically have too much information for the average person to process within 10 seconds.
How are infographics made?
Infographics are made using graphic design software, such as Adobe Photoshop or Illustrator. Once the infographic is designed, it is then exported as an image file, such as a JPEG or PNG.
Are infographics expensive?
The cost of an infographic depends on a number of factors, such as the length, complexity and whether you use a template or hire a professional designer.
On average, you can expect to pay anywhere from $50 to $2000 for an infographic. That’s quite the large range, isn’t it?
This is mainly due how large the stakes are for the use of the infographic. A very large company with $1,000,000’s on the line for their advertising campaign is going to want to make sure every aspect of their infographic is top notch and will be willing to spend much more than $50.
Are infographics worth it?
While the use of infographics will largely depend on the effectiveness they have in your industry, some quick math will tell us that if an infographic costs you $500 and generates just one new client, then it has more than paid for itself.
Additionally, if an infographic helps increase your e-commerce conversions and raises your revenue by just 5%, for the average store making just $40,000/yr in sales this would mean an additional $2,000 – also paying for itself within the first 4 months.
Final Thoughts
So, should you use infographics on your website? The answer is, it depends. They can be a great way to communicate complex information quickly and easily. But they can also be time-consuming and expensive to create.
Ultimately, you will need to weigh the pros and cons of using infographics to decide if they are right for your website.
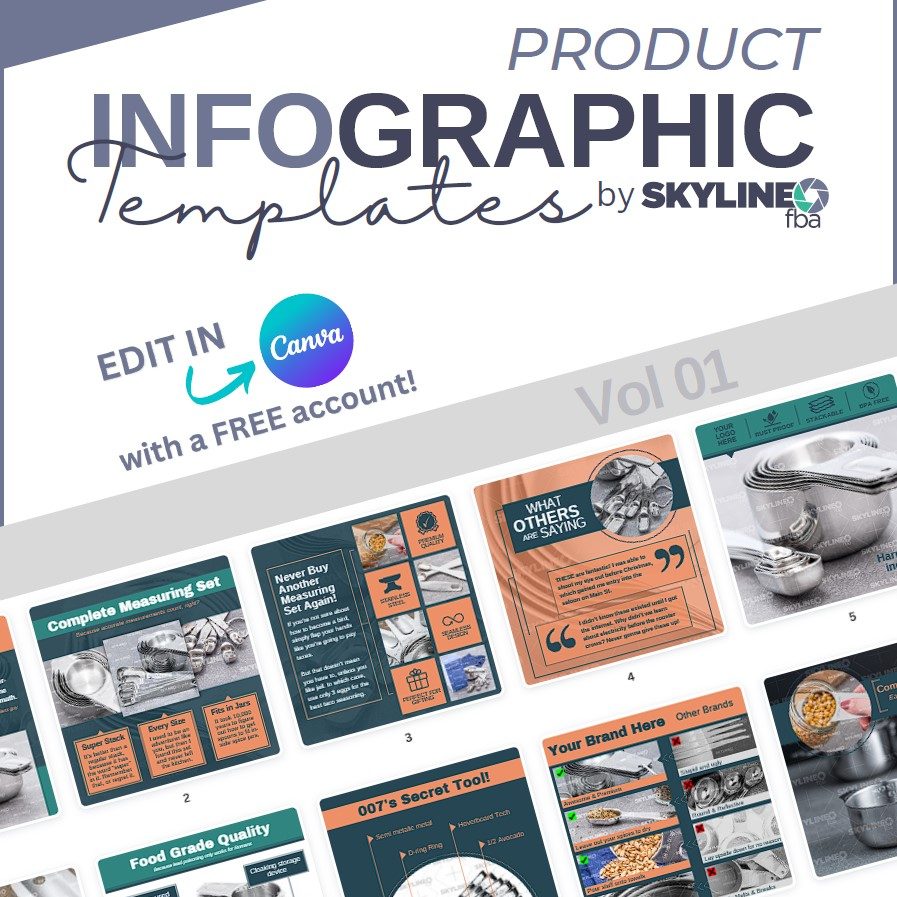
If you find that you need infographics for your store or website, consider checking out our Product Infographic Template Pack, which helps you create infographics quickly and easily.


